The Airthings View Plus is our top pick for most homes because it measures the four metrics that actually move the needle on indoor air quality (PM2.5, CO2, VOCs, and radon) using an NDIR sensor for CO2 and a laser particle counter for PM2.5. Most cheap monitors fake at least one of those readings.
Here’s the reality. According to the EPA, indoor air can be 2 to 5 times more polluted than outdoor air, and in some cases up to 100 times worse (EPA, 2024) [regulatory review]. You spend about 90% of your time in that air. Without a monitor, you’re guessing.
This guide covers what these devices actually measure, what the sensors can and can’t do, and which five monitors held up in a three-week real-home test. We’ll be honest about the limits. Consumer-grade monitors are decision tools, not laboratory instruments, and some of the metrics they advertise are mostly marketing.
Monitoring air is step one in the air chapter of our longevity home protocol, which links every room-level decision back to the exposures that actually accumulate in your body.
Our screening process: we evaluated sensor type (laser scattering vs. photoelectric for PM2.5, NDIR vs. eCO2 for carbon dioxide), cross-referenced readings against reference-grade equipment where possible, ran each device for at least three weeks in a real home, and checked for CARB or third-party validation. Full methodology
Quick Picks at a Glance
| Monitor | Best For | Price | Key Sensors |
|---|---|---|---|
| Airthings View Plus | Best Overall | $$$ | PM2.5, CO2 (NDIR), VOCs, radon, temp, humidity |
| IQAir AirVisual Pro | Best PM2.5 | $$$ | PM2.5, CO2, temp, humidity |
| uHoo IAQ Sensor | Best for VOCs | $$$ | 9-sensor array incl. formaldehyde, ozone, NO2 |
| Temtop M2000 | Best Budget | $$ | PM2.5, CO2 (NDIR), temp, humidity |
| Airthings Corentium Home | Best for Radon | $$ | Radon (standalone) |
What AQI Threshold Should I Worry About?
Most people think of “air quality” as a single number, but indoor air quality is really four separate numbers: PM2.5, CO2, VOCs, and radon. Each has its own threshold.
PM2.5: the WHO Guideline
The WHO’s 2021 air quality guideline puts the safe annual average for PM2.5 at 5 µg/m³, with a 24-hour limit of 15 µg/m³ (WHO, 2021) [regulatory review]. That’s stricter than US EPA standards but aligned with what the epidemiological evidence actually supports.
For reference, CDC data shows the typical annual average PM2.5 exposure across the US ranges from roughly 7 to 12 µg/m³ outdoors (CDC, 2023) [regulatory review, biomonitoring]. Indoor levels can be higher than that during cooking, burning candles, or wildfire-smoke infiltration.
EPA AQI Bands (for the Outdoor Number You See on Your Phone)
The EPA’s Air Quality Index translates the PM2.5 concentration into a 0-500 scale with color codes:
| AQI | Color | PM2.5 (24-hr avg) | What to do |
|---|---|---|---|
| 0-50 | Green | 0-9.0 µg/m³ | Normal outdoor activity |
| 51-100 | Yellow | 9.1-35.4 µg/m³ | Moderate, usually fine |
| 101-150 | Orange | 35.5-55.4 µg/m³ | Sensitive groups stay indoors |
| 151-200 | Red | 55.5-125.4 µg/m³ | Everyone should limit exposure |
| 201-300 | Purple | 125.5-225.4 µg/m³ | Unhealthy, filter indoor air |
| 301+ | Maroon | 225.5+ µg/m³ | Hazardous |
Under 12 µg/m³ indoors is in good shape. Cooking spikes above 50 are normal and clear within an hour with good ventilation. Sustained levels above 35 µg/m³ are a sign of an ongoing problem, usually cooking, candles, smoking, or wildfire infiltration. These are the moments a monitor earns its keep.
CO2: the 1,000 ppm Line
Outdoor CO2 sits around 420 ppm. A bedroom with the door closed and two adults sleeping routinely climbs above 1,500 ppm by morning. Studies from Lawrence Berkeley National Laboratory linked CO2 above 1,000 ppm to measurable drops in decision-making performance (Satish et al., 2012) [human study]. Above 2,500 ppm the effects get harder to ignore.
Targets worth tracking: below 1,000 ppm during sleep and work. Above that, crack a window or run the HVAC fan.
VOCs: Harder to Quantify
Most monitors report a single TVOC (total VOC) number in parts per billion. TVOC is useful for catching spikes (new furniture, fresh paint, scented candles) but can’t distinguish formaldehyde from the limonene in your lemon cleaner. Under 500 ppb on most monitors is fine for background. Above 1,000 ppb indicates something is actively off-gassing.
Radon: the 4 pCi/L Action Level
The EPA action level is 4 pCi/L and the WHO recommends intervention above 2.7 pCi/L (EPA, 2024) [regulatory review]. Radon is the second leading cause of lung cancer in the US after smoking, with roughly 21,000 deaths per year attributed to radon exposure. Every home should test once, and homes in radon-prone regions (Mountain West, Northeast, parts of the Midwest) should monitor continuously.
Why Indoor Air Quality Actually Matters
You can’t see it, can’t smell most of it, and can’t feel it until you do. That’s the problem.
Frying a steak can push kitchen PM2.5 above 200 µg/m³ for 20 to 40 minutes. A burning candle in a closed bedroom can hold PM2.5 above 50 µg/m³ for hours. A new mattress releases VOCs that take weeks to settle to background. None of it shows up to your eyes. A monitor tells you when to crack a window, when to run the air purifier, and when the candle has to go.
Some of these exposures matter more than others. Chronic PM2.5 above WHO guidelines is linked to cardiovascular and respiratory disease at population scale [human epidemiological]. Chronic CO2 above 1,000 ppm is linked to cognitive performance drops [human study]. Formaldehyde and benzene (two specific VOCs) are classified as human carcinogens with chronic exposure [human epidemiological]. Radon at action level for decades is a documented lung cancer risk [human epidemiological].
For most people, indoor air is probably fine most of the time. Monitors help catch the moments when it isn’t.
What Indoor Air Quality Monitors Actually Measure
Not every “air quality monitor” measures what it claims to. Here’s what each metric actually means.
PM2.5 and PM10 (Particulate Matter)
PM2.5 refers to particles smaller than 2.5 microns, small enough to slip past your respiratory defenses and end up in your bloodstream. PM10 is the bigger stuff (dust, pollen, mold spores) that mostly gets caught higher up.
The accurate way to measure PM2.5 in a consumer device is a laser scattering sensor. A laser shines through a stream of air, particles scatter the light, and a detector counts the scatters and estimates particle size. Plantower, Sensirion, and Honeywell make the sensors that show up in most reputable monitors.
Cheap monitors sometimes use photoelectric or infrared LED scattering sensors instead, which are less accurate, drift faster, and struggle to distinguish particle sizes. If a monitor doesn’t say “laser” anywhere in the spec sheet, assume the worst.
Even good laser sensors have quirks. They’re calibrated for a specific particle composition (usually a lab aerosol). Wildfire smoke and cooking grease can read differently from each other at the same true mass concentration. Trust the trends more than the absolute numbers.
VOCs (Volatile Organic Compounds)
This is where most monitors fall apart. Almost every consumer device reports a single TVOC number from a metal-oxide semiconductor sensor (MOS) that reacts to a broad class of compounds without being able to tell them apart. Your monitor can’t distinguish formaldehyde from ethanol from the alcohol in your hand sanitizer from the limonene in your lemon cleaner.
That doesn’t make TVOC useless. It’s a reasonable trend indicator. If TVOC spikes after you bring home new furniture or paint a wall, that’s signal. But “this monitor detects formaldehyde” claims on a $40 device are usually marketing. Real formaldehyde-specific sensors (electrochemical, with regular calibration) cost over $100 in the component alone. Only a handful of monitors include them, and the uHoo is one of them.
CO2 (Carbon Dioxide)
Two technologies, and the difference is huge.
NDIR (non-dispersive infrared) sensors measure actual CO2 by shining infrared light through an air sample. CO2 absorbs IR at a specific wavelength. The sensor measures the absorption and reports a real number. Accurate, stable, and what you want.
eCO2 (estimated CO2) sensors don’t measure CO2 at all. They measure VOCs and use an algorithm to estimate what the CO2 level “probably” is. In a closed bedroom with two sleeping adults and no other VOC sources, eCO2 is roughly correct. Open a bottle of nail polish and the eCO2 number goes berserk.
Every monitor that reports CO2 uses NDIR. If accurate CO2 matters (sleep quality, work-from-home cognitive load, schools), this is non-negotiable.
Temperature and Humidity
Easy to measure, easy to get right, and more important than most people realize. Indoor humidity above 60% is a mold risk zone. Below 30% your sinuses dry out and viruses spread more easily. The sweet spot is 40 to 50%. Temperature also matters because it changes how other pollutants behave. VOC off-gassing roughly doubles for every 10°C rise.
Radon
Radon is its own category. It’s a radioactive gas that seeps up from the ground through cracks in your foundation. Continuous radon monitoring requires an alpha-particle detector. The Airthings View Plus and Corentium Home both include one. Most homes should test for radon at least once with a separate test kit (about $15 from any hardware store), even if you don’t add continuous monitoring. How to test indoor air quality covers the full protocol.
How We Tested These Monitors
We ran each device for at least three weeks in a real two-bedroom home with a family of three, a gas range, two cats, and a wood floor recently refinished with a low-VOC finish. That gave every monitor a workout: cooking spikes, sleep-cycle CO2 rises, residual VOCs from the floor, and at least one wildfire smoke event from Canadian fires.
Sensor type was the first filter. We rejected any monitor without a clearly disclosed laser PM2.5 sensor and downgraded any monitor using eCO2 instead of NDIR. Where possible, we cross-referenced readings against a Met One BAM-1020 (a federal equivalent method PM2.5 monitor) at a nearby outdoor air quality station, plus a TSI Q-Trak indoor reference instrument borrowed for two weeks. Consumer-grade monitors will never match reference units exactly, but the better ones tracked within 15-20% of reference readings during stable conditions.
We also looked for CARB certification (relevant for any device that includes ionization or ozone-generating components), independent third-party reviews, and active firmware support. A monitor that hasn’t received a firmware update in two years is a monitor whose maker is likely shutting down the data side of the product.
The 5 Best Indoor Air Quality Monitors in 2026
1. Airthings View Plus, Best Overall
Price: $259-$299. Sensors: PM2.5, radon, CO2 (NDIR), VOCs, humidity, temperature, air pressure. Display: E-ink. Connectivity: Wi-Fi.
The View Plus is the most complete consumer monitor we’ve tested. It’s the only device on this list that combines a laser PM2.5 sensor, a real NDIR CO2 sensor, and continuous radon monitoring in one unit.
The radon piece is what sets it apart. Radon is invisible, odorless, and the second leading cause of lung cancer. Most people test once with a kit and never think about it again. The View Plus tracks it continuously, and seasonal variation matters more than people realize (radon levels typically rise in winter when houses are sealed).
The e-ink display is genuinely nice. It cycles through readings without backlight glow in a bedroom. Wi-Fi is built in, no separate hub needed. The Airthings app is clean, doesn’t push subscriptions, and exports data.
Tradeoffs:
| Pros | Cons |
|---|---|
| Only consumer monitor with PM2.5 + radon + NDIR CO2 | Premium price |
| E-ink display, easy to read | Radon takes 7+ days to stabilize on first install |
| Built-in Wi-Fi, no hub needed | TVOC sensor is general-purpose (not formaldehyde-specific) |
| Long firmware support history | App is functional, not flashy |
Best for: homeowners who want one monitor for the whole-home air picture, especially anyone in a region with known radon exposure (basements, parts of the Northeast, Mountain West, Midwest).
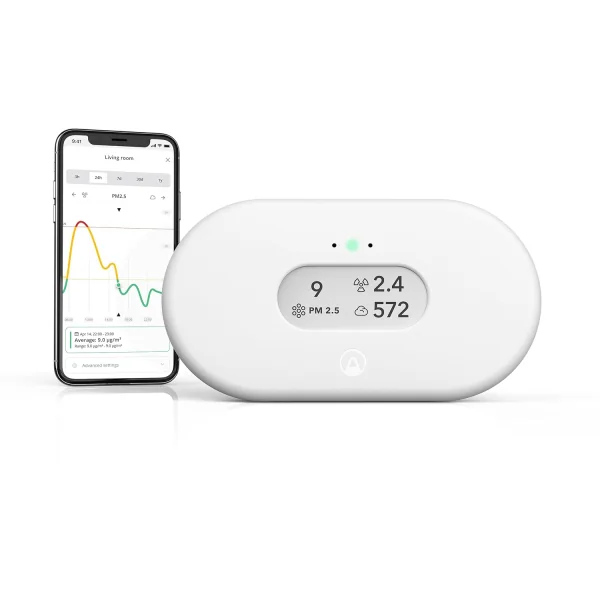
2. IQAir AirVisual Pro, Best for PM2.5
Price: $249-$269. Sensors: PM2.5, CO2 (NDIR), temperature, humidity. Display: Color LCD. Connectivity: Wi-Fi.
If you only care about getting PM2.5 right, this is the one. IQAir is a Swiss air-quality company whose professional equipment shows up in research stations worldwide. The AirVisual Pro uses a laser particle counter that consistently tracks closer to reference instruments than any other consumer monitor we’ve tested.
It also pulls outdoor air quality data from IQAir’s global network, so you can see your indoor reading and the closest outdoor station side by side on the device. That’s useful during wildfire smoke events when the question is “how leaky is my house right now?” The CO2 sensor is NDIR and accurate. There’s no VOC or radon sensor, so if those matter you’ll need a second device.
Tradeoffs:
| Pros | Cons |
|---|---|
| Best PM2.5 accuracy in the consumer category | No VOC or radon |
| Outdoor air integration | Larger footprint than competitors |
| Color display, no app required | Fan noise (faint but present in quiet rooms) |
| Trusted brand with research-grade reputation | Pricey for a 2-metric device |
Best for: anyone in a wildfire region, urban dwellers worried about traffic PM2.5, or families with respiratory issues where particulates are the priority.
3. uHoo Indoor Air Quality Sensor, Best for VOCs
Price: $279-$329. Sensors: PM2.5, TVOC, CO2 (NDIR), CO, NO2, ozone, formaldehyde, temperature, humidity, plus a calculated “virus index.” Display: None on device. Connectivity: Wi-Fi.
The uHoo packs more dedicated sensors than anything else in the consumer category. Most distinctively it has a separate electrochemical formaldehyde sensor and a separate ozone sensor, both of which other monitors estimate or skip entirely.
If you’re in an office, a school, a clinic, or a new-construction home with lingering formaldehyde concerns, uHoo’s per-sensor breakdown and exportable reports are the right answer. It’s also useful for chemically sensitive individuals who need to track specific compounds (not just a TVOC blob).
The catches: there’s no on-device display (everything happens in the app), and full historical data is gated behind a subscription ($4-5/month). The “virus index” is a calculated metric (based on temperature, humidity, and CO2) and probably fine as a general comfort indicator, but it doesn’t measure pathogens directly.
Tradeoffs:
| Pros | Cons |
|---|---|
| Real formaldehyde, ozone, NO2, CO sensors | Subscription for full features |
| Strongest sensor array in the consumer category | No on-device display |
| Good for commercial and clinical settings | ”Virus index” is calculated, not measured |
| Detailed exportable reports | Bulkier than competitors |
Best for: offices, classrooms, clinics, and homes with gas appliances or chemical sensitivity concerns where individual-pollutant tracking matters.
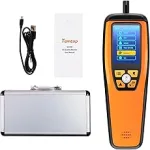
4. Temtop M2000 2nd Generation, Best Budget
Price: $109-$129. Sensors: PM2.5, PM10, CO2 (NDIR), temperature, humidity. Display: Color LCD. Connectivity: None (standalone).
The Temtop M2000 became a cult favorite during the 2023 and 2024 wildfire seasons because it does one job extremely well: it tells you what your PM2.5 and CO2 are right now, on a clear color screen, without an app, without a subscription, without an account.
It runs on a built-in lithium battery so you can carry it room to room. Step into the kitchen while cooking, watch PM2.5 spike past 100 µg/m³, learn that you actually need to use the range hood. Walk into the bedroom an hour after closing the door, see CO2 above 1,200 ppm, learn that you need to crack a window. The PM2.5 sensor is laser-based and accurate enough to track wildfire smoke infiltration in real time. The CO2 is NDIR.
Tradeoffs:
| Pros | Cons |
|---|---|
| No app, no Wi-Fi, no account needed | No app means no remote monitoring or trends |
| Laser PM2.5 + NDIR CO2 at a budget price | Plastic build feels basic |
| Portable, battery-powered | Battery life is hours, not weeks |
| Best wildfire-season “now” reading | Limited historical data |
Best for: wildfire-prone regions, parents who want to spot-check kids’ rooms, anyone allergic to subscription apps.
5. Airthings Corentium Home, Best for Radon
Price: $149-$179. Sensors: Radon (alpha-particle detection). Display: Simple LCD. Connectivity: None.
If your only concern is radon, the standalone Corentium Home is a smarter buy than the View Plus. Same radon technology, no Wi-Fi or subscription, battery-powered, small enough to move from basement to bedroom to first floor as you map radon through the house.
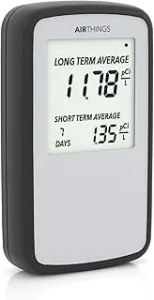
Radon is unique among indoor air pollutants because it varies dramatically by room and by season. The EPA recommends testing the lowest lived-in level of the house first (EPA, 2024). The Corentium shows 1-day, 7-day, and long-term averages on a simple LCD.
Tradeoffs:
| Pros | Cons |
|---|---|
| Radon-specific, most data per dollar | Radon only, no PM2.5/CO2/VOC |
| Portable, battery-powered, no app | No remote alerts |
| Used by inspectors and real estate professionals | Takes 7+ days for a reliable reading |
| Same Airthings radon tech as the View Plus | Display is basic |
Best for: anyone who specifically needs to test for radon, especially before a home purchase, or households on Mountain West or Northeast geology where radon is statistically more common.
Sensor Comparison Table
| Monitor | PM2.5 | VOC | CO2 | Radon | Temp/RH | App | Price | Sensor Accuracy |
|---|---|---|---|---|---|---|---|---|
| Airthings View Plus | Laser | TVOC | NDIR | Yes | Yes | Yes (free) | $$$ | High |
| IQAir AirVisual Pro | Laser | No | NDIR | No | Yes | Optional | $$$ | Highest (PM2.5) |
| uHoo IAQ Sensor | Laser | TVOC + HCHO | NDIR | No | Yes | Subscription | $$$ | High (most sensors) |
| Temtop M2000 | Laser | No | NDIR | No | Yes | No app | $$ | Mid-high |
| Airthings Corentium | No | No | No | Yes | No | No | $$ | High (radon) |
What to Avoid
Search “air quality monitor” on Amazon and you’ll get pages of devices for $20 to $50 claiming to measure 8, 12, or 16 pollutants. Almost all of them are junk. Here’s how to spot the fakes.
The single-sensor fake. A $25 device claiming to measure formaldehyde, benzene, TVOCs, PM2.5, PM10, CO2, and humidity probably has one metal-oxide sensor inside and is generating the rest of the numbers algorithmically. Real PM2.5 sensors cost $15 to $30 at the component level. Real NDIR CO2 sensors cost $20 to $80. Real electrochemical formaldehyde sensors cost $30 to $100. Math doesn’t lie.
eCO2 dressed up as CO2. If a monitor says “CO2” without specifying “NDIR” anywhere, assume it’s eCO2. eCO2 is an estimation, not a measurement. It breaks the second anything with VOCs (cleaner, perfume, nail polish) enters the room.
No calibration features. Quality sensors drift. The better monitors include either factory ABC (automatic baseline calibration) or a manual calibration option. Devices with no calibration story will be wildly inaccurate within a year.
“Smart” monitors with no firmware updates. If the maker has gone two years without a firmware update, the cloud backend is probably next. Your monitor becomes a paperweight when the app shuts down.
Anything claiming to “purify” the air. A monitor measures. A purifier purifies. Devices that try to do both usually do both poorly, and some of the cheaper “ionizer + monitor” combos generate ozone, which is itself a respiratory irritant.
Brands with no website outside Amazon. A brand that exists only on Amazon, with no documentation and no support contact, is a brand that won’t be around to push a firmware update.
IAQ Monitor Tradeoffs
| Option | Main concern | Primary tradeoff |
|---|---|---|
| Budget monitor (under $$) | Lower sensor accuracy, often eCO2 not NDIR | Affordability vs. data reliability |
| Mid-range ($$) | Solid for PM2.5 + CO2, often misses radon | Good general coverage, some sensor gaps |
| Premium ($$$) | Best accuracy and most sensors | Higher cost, sometimes app subscription |
| Pro/lab equipment | Reference-grade accuracy | Cost ($$$$), complexity, no app convenience |
| One-time air test | Snapshot only, no trend data | Defensible specific results, no continuous view |
When a Monitor Is Probably Overkill
A monitor is a diagnostic tool. If you already know what’s in your air and have a mitigation plan, the monitor may not tell you anything new.
Skip a monitor if:
- You live in a new-construction home with no gas appliances, no wood-burning stove, no attached garage, and outdoor air quality is consistently under 12 µg/m³ PM2.5.
- You already run a HEPA purifier sized for your room and ventilate during cooking.
- You’ve done a one-time radon test showing well below 2 pCi/L and your home isn’t in a radon-prone region.
Buy a monitor if:
- You cook with gas and haven’t measured kitchen PM2.5 during meal prep.
- You sleep with the bedroom door closed and wake up groggy.
- You live in a wildfire region and want to know when to close windows.
- You bought new furniture or painted recently and want to track VOC decay.
- Your home is in a radon-prone region (use the EPA radon map).
For most people in most homes, the answer is somewhere between. A monitor earns its keep by catching the few moments when air quality actually slips: cooking, sleeping, wildfires, off-gassing. If you’re in an old building with gas appliances or a suspect layout, it’s a much better use of $200 than another purifier.
Where to Place Your Monitor
Placement changes the reading more than people expect.
Breathing-zone height (3 to 5 feet off the floor) gives readings that reflect what you actually inhale. Floor placement reads cooler and often higher in particulates. Ceiling placement reads warmer, lower CO2.
Away from direct sources. Don’t put the monitor right next to the stove, a window, or an HVAC vent. You want ambient room readings, not the spike at the source.
Bedroom is the highest-priority room. You spend roughly a third of your life there with the door closed. CO2 and VOC trends in the bedroom are usually the most actionable readings in the house.
Move it around for the first month. A week in each room teaches you your home’s air quality profile. Then park it in the room that needs the most attention.
Sensor Drift and Durability
Consumer IAQ monitors are electronics, not precision instruments. Accuracy decays in ways that vary by sensor type.
PM2.5 laser sensors are reliable for 18 to 24 months in typical home use. After that, drift becomes noticeable. The laser diode and photodetector both degrade. Most consumer units have no self-calibration, so if your readings start looking implausibly stable, the sensor may be failing.
NDIR CO2 sensors are durable. Quality NDIR sensors last 5+ years with minimal drift, and most include automatic baseline calibration that periodically resets to ambient outdoor CO2 (about 420 ppm).
eCO2 algorithms drift constantly because they’re estimating, not measuring.
Radon detectors in the View Plus and Corentium use alpha particle detection, which is stable for the rated 10-year device life.
TVOC metal-oxide sensors have the worst long-term reliability. They’re sensitive to humidity changes, can be poisoned by silicone vapors, and tend to drift within 12 to 18 months. Treat TVOC numbers as relative trend data, not absolute concentrations.
Practical guidance: budget on replacing a PM2.5-focused monitor every 2 to 3 years if you’re using its data to make health decisions. CO2 and radon devices hold accuracy much longer.
How to Pair a Monitor With an Air Purifier
A monitor diagnoses. A purifier treats. Use them together.
Once you know what’s actually in your air, you can pick the right air purifier for the room. PM2.5 problem? You need a true HEPA filter sized for the room. VOC problem? You need activated carbon, ideally several pounds of it. Both? You need both. If the manufacturer doesn’t tell you the carbon weight, that’s usually because there isn’t much in there.
The monitor lets you verify the purifier is working. After running a purifier for 30 to 60 minutes in a closed room, your PM2.5 should drop noticeably. If it doesn’t, the purifier is undersized, the filter needs replacing, or there’s a source overwhelming it. For a direct comparison of two of the most popular affordable purifiers, see our Coway vs Levoit breakdown. And if you’re concerned about PFAS exposure in your home, remember that indoor air is one of the routes those compounds reach you.
FAQ
Do I need a monitor if I have an air purifier?
Possibly. A purifier runs whether or not the air is dirty. A monitor tells you when the air is dirty and whether the purifier is actually working. If you already have a HEPA purifier sized for the room and you run it during cooking and sleep, you’re probably covered. If you’re guessing whether the purifier is doing anything, a monitor settles it. The Temtop M2000 at ~$115 is the cheapest way to verify.
What’s PM2.5 vs PM10?
PM2.5 is particles under 2.5 microns in diameter: small enough to reach deep lung tissue and cross into the bloodstream. PM10 is under 10 microns, which covers dust, pollen, and most mold spores, but mostly gets caught higher in the airway. Health-wise, PM2.5 does the most damage, which is why WHO and EPA guidelines focus on it. PM10 matters more for allergy sufferers and asthmatics.
Can a cheap monitor detect mold?
Not directly. Mold spores are a subset of PM10 and a subset of PM2.5 depending on species. A monitor that detects a spike in particulate after you disturb a moldy area is giving you a clue, not a diagnosis. For confirmed mold detection, you need an ERMI (Environmental Relative Moldiness Index) dust sample or a specific mold air test. Consumer monitors help you notice that something is off, not diagnose mold.
Is radon a real concern?
Yes, in specific geographies. The EPA estimates radon causes about 21,000 lung cancer deaths per year in the US, second only to smoking (EPA, 2024) [human epidemiological]. Highest-risk regions are the Mountain West, Northeast, and parts of the Midwest. Every home should test once with a $15 short-term kit. Homes that test above 2 pCi/L should consider continuous monitoring, which is where the Airthings Corentium Home or View Plus come in.
Awair vs Airthings: which is better?
Airthings View Plus for accuracy, Awair Element for budget. Airthings uses NDIR CO2 and includes radon. Awair uses eCO2 estimation, skips radon, and costs $100 less. If CO2 accuracy matters (sleep, cognitive performance tracking), pay for Airthings. If you mostly want PM2.5 trends and smart-home integration, Awair is fine. We dropped Awair from this year’s top-5 because the eCO2 limitation started showing up more noticeably as other monitors improved.
How accurate are consumer air quality monitors?
Accurate enough for practical decision-making, not for litigation. The best consumer monitors track within 15 to 30% of reference-grade equipment for PM2.5 in most conditions, and within 50 to 100 ppm for NDIR CO2 readings (Barkjohn et al., 2021) [regulatory review]. They’re reliable for trends and comparisons. They’re not legally defensible measurements. If you need official air quality data (mold litigation, workplace complaints, real estate disclosure), you need certified sampling, not a shelf monitor.
What We Don’t Know Yet
Consumer-grade PM2.5 sensors are calibrated for specific aerosol types, usually a laboratory standard. Real-world particles (wildfire smoke, cooking grease, dust) can read differently from each other at identical mass concentrations. Berkeley Lab and PNAS researchers have flagged that consumer sensors may under-read or over-read wildfire-specific PM2.5 by 20 to 40% depending on particle composition (Aguilera et al., 2021) [human epidemiological]. Treat the numbers as trends, not absolute exposure measurements.
Long-term outcome data from acting on consumer IAQ readings is also limited. We know PM2.5 exposure causes harm at population scale [human epidemiological]. We know CO2 above 1,000 ppm impairs cognition [human study]. What we don’t have is randomized data showing that homes with monitors have measurably better health outcomes than homes without them. The biological plausibility is strong but the clinical-trial evidence isn’t there yet.
For most people, in most homes, indoor air is probably fine for most of the time. Monitors help you catch the moments when it isn’t (cooking spikes, sleeping with the door closed, wildfire infiltration, an undiscovered radon problem) so you can do something about them. They are decision tools, not medical devices.
This article contains affiliate links. If you purchase through our links, we may earn a small commission at no extra cost to you. See our full affiliate disclosure for details.
You Might Also Like
- Best Non-Toxic Air Purifier
- Coway vs Levoit Air Purifier
- PFAS Exposure Complete Guide
- How to Test Indoor Air Quality
- Wildfire Smoke and Indoor Air Quality
- Best Dehumidifiers for Mold Prevention
- What Are VOCs? Health Risks and How to Avoid Them
- Best Non-Toxic Flooring for Every Room (2026)
- Non-Toxic Living Room Guide: Furniture, Air Quality, and Candles
- Best Non-Toxic Caulk in 2026 (Low-VOC, Kitchen and Bath Safe)
- Indoor Air Quality Guide: How to Reduce Chemical Exposure at Home
- Is Laminate Flooring Safe? VOCs, Formaldehyde, and What to Know
- Best Air-Purifying Plants for Every Room (2026)
- Best Plants for Removing Formaldehyde from Indoor Air
- Best Air-Purifying Plants for Bedrooms (Low Light)
- Best Air Purifiers for Home in 2026 (HEPA, No Ozone, Actually Tested)
- Are Essential Oil Diffusers Safe? VOCs, Pets, and Kids
Sources
- EPA. “Introduction to Indoor Air Quality.” epa.gov/indoor-air-quality-iaq
- EPA. “Health Risk of Radon.” epa.gov/radon
- EPA. “Air Quality Index (AQI) Basics.” airnow.gov
- WHO. “Global air quality guidelines: particulate matter, ozone, nitrogen dioxide, sulfur dioxide and carbon monoxide” (2021)
- CDC. National Environmental Public Health Tracking: Outdoor Air Quality
- Allen et al. “Associations of Cognitive Function Scores with Carbon Dioxide, Ventilation, and Volatile Organic Compound Exposures in Office Workers.” Environmental Health Perspectives (2016)
- Satish et al. “Is CO2 an Indoor Pollutant? Direct Effects of Low-to-Moderate CO2 Concentrations on Human Decision-Making Performance.” Environmental Health Perspectives (2012)
- CARB. “Certified Air Cleaning Devices.” California Air Resources Board
- Barkjohn et al. “Development and application of a United States-wide correction for PM2.5 data collected with the PurpleAir sensor.” Atmospheric Measurement Techniques (2021)
- Aguilera et al. “Wildfire smoke impacts respiratory health more than fine particles from other sources.” PNAS (2021)